Pakistan’s unsafe water

By Hina Shaikh and Ijaz Nabi
water-scarcity-1470091189-8106

Safe drinking water is a central plank of a country’s health strategy as it affects nutrition intake and therefore infant mortality, child growth, and the ability of adults to be productive. Exposure to unsafe water also leads to skin-related disease. For these reasons, access to safe drinking water is a right enshrined in the constitution and is a critical Sustainable Development Goal.

The Consortium for Development Policy Research (CDPR) recently brought together a panel of experts to discuss the current status of drinking water in Pakistan and what is being done to ensure that citizens enjoy this constitutional right.

Pakistan’s “water stress”

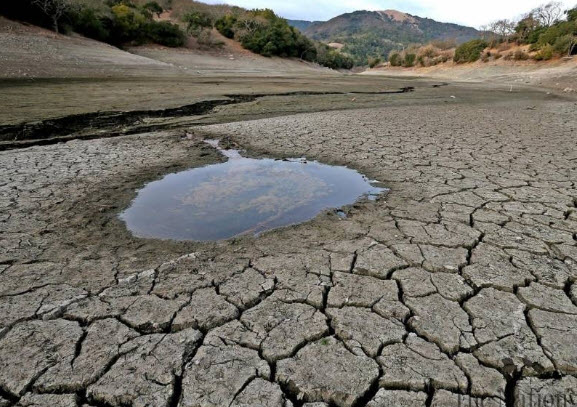
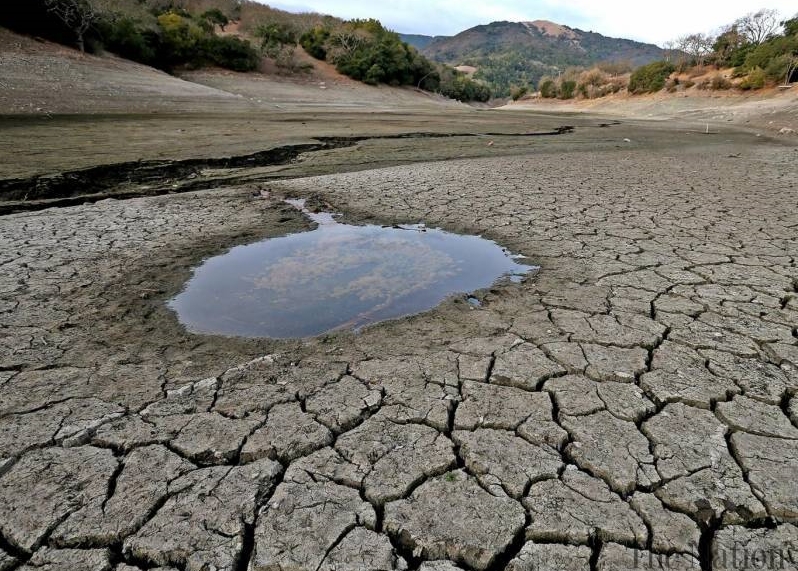
The panel distinguished between “water scarcity” and “water stress”. With the world’s fourth highest rate of water use, Pakistan’s economy is one of the most water-intensive in terms of cubic meters consumed per unit of GDP. Subsequently, water availability per capita has shrunk to under one thousand cubic meters by 2017 from over five thousand in 1951. Pakistan crossed the “water scarcity line’” in 2005, indicating a shortage of overall supply. With higher than expected population growth, this is likely to get worse.

The focus of the discussion was primarily on “water stress”, or the prevalence of polluted water that is unsafe to drink. Panelist Syed Hasan, Assistant Professor of Economics at the Lahore University of Management Sciences, noted that Pakistan became a water-stressed country in 1990 and is expected to be among the most water-stressed countries in the world by 2040.

Panelist Hammad Khan, Director General of World Wild Fund for Nature (WWF) Pakistan, pointed out that the level of arsenic in the water supply far exceeds the government’s own thresholds for contamination, which are in fact less conservative the World Health Organization’s (WHO) standards. A 2015-16 nation-wide survey by the Pakistan Council of Research in Water Resources (PCRWR) found that only a third of the 369 samples tested for water quality were safe for consumption. A separate PCRWR study conducted in 2011 found 100 percent of water samples in Lahore were polluted with arsenic. A study led by Joel Podgorski, a scientist at the Swiss Federal Institute of Aquatic Science and Technology, found that water in two-thirds of the 1200 wells sampled across Pakistan exceeded the WHO-recommended threshold of arsenic. Based on this data, nearly 60 million citizens are estimated to be consuming toxic ground water.

Microbial pollution is also common. In cities, water becomes contaminated due to improper disposal of solid waste and continued usage of outdated water and sewage networks. Chemical pollutants from industrial waste also infect water. In rural areas, open defecation and animal waste are the leading sources of contamination.

Poor quality of water burdens the health sector, increases missed days of work, and reduces labor productivity. High levels of arsenic in water contributes to underweight birth, skin defects and miscarriages. Syed Hasan mentioned the burden of poor health outcomes in the form of waterborne diseases costs Pakistan 1.6 million disability-adjusted life years – and almost four percent of GDP.

Poor governance

Pakistan has been unable to incentivize conservation and efficient usage of water. Syed Hasan commented on the pricing mechanism and its failure to reflect the true market value of this critical resource. The tariff for water used for household consumption in urban Pakistan was last revised in 2004. Operation and maintenance costs incurred by water authorities continue to exceed the revenue they collect, while water metering covers only eight percent of the households.

Hammad Khan explained that if sources of water remain unprotected, the availability of drinking water will keep dwindling. Ground water once contaminated cannot be treated. The installation of filtration plants by Punjab’s Saaf Pani Company (see below), meant to cover all union councils in Punjab, are remedial measures – not sustainable solutions. The unrelenting adulteration of water sources despite decades of several dedicated water authorities in operation reflects a serious governance failure.

The government response in Punjab

Following devolution, water became a purely provincial subject. Punjab set up the Saaf Pani Company three years ago to ensure provision of drinking water in rural Punjab. The company’s progress is personally overseen by the chief minister.

Panelist Tahir Majid, Chief Technical Officer, Punjab Saaf Pani Company, agreed that despite being the Punjab government’s flagship initiative and substantial public expenditure, progress has been slow. A third of the water schemes in the province remain non-functional while 79 percent provide water that is unsafe for consumption.

The problem with Saaf Pani Company reflects a deeper problem of governance pervasive across several other sectors. When parallel governance structures are set up in the presence of existing departments, such as the Punjab Health and Engineering Department, inefficiencies slide in. The company saw several quick changes in senior management (some resulting in criminal inquires) and frequent changes in the operational design. This has resulted in delays and has not encouraged strong private sector engagement in the delivery of safe drinking water to the citizens.

After being heavily scrutinized for its performance, the company is now restructuring itself to improve delivery and remains committed to providing clean drinking water to Punjab’s entire unserved population of 60 million by 2025.

What can be done?

It is encouraging that “water-stress” can be overcome. Singapore’s example, cited by Syed Hasan, shows how the risk of extreme water stress can be countered by efficient regulation and management. Inaction, however, may result in a crisis similar to the one in Cape Town, a city that is now on the verge of rationing clean drinking water.

The panel suggested immediate steps Pakistan can take to tackle the water crisis and avoid the Cape Town outcome:

Set the right priorities: An over-arching water policy framework is critical. The National Water Policy, in circulation since 2004, should be updated in light of changes and approved.

Set water classification standards: Every country (including India, Bangladesh, and China) has water classification standards where all the water bodies are categorized according to their usage. This should also be done in Pakistan. WWF has offered to use remote sensing and GIS mapping to help government conduct this exercise. Authorities will then be able to ensure more effectively that water bodies classified for drinking purposes are kept clean and used for that purpose alone. Water classification will also help avoid disputes between different stakeholders (agriculture vs. industrial vs. household consumption).

Let prices work: Even though water is a basic right, it is a limited resource and hence water pricing is important. The fact that people pay for bottled water indicates that there is willingness to pay.

Mobilize community ownership: Community ownership is key to ensuring that water schemes remain functional and well-maintained. The WWF for example signs a legal contract with the community for joint ownership of the filtration plants it has provided.

Hina Shaikh is a Pakistan country economist at the International Growth Centre.

Drive cautiously down China’s Belt and Road

KarachiPort

By Shahid Yusuf

China’s Belt and Road Initiative (BRI) aims to create a Eurasian economic corridor and a string of economic hubs anchored to Chinese cities,  thereby generating a development dynamic that is advantageous to China’s growth. The investment and trade generated by BRI could enable China to sustain a growth rate of 6 to 7 percent and double its GDP between 2010 and 2021. As of end 2016, $900 billion worth of BRI-related projects were planned or under implementation – with loans and credits from Chinese banks amounting to $1.2 trillion (not all for BRI projects). Chinese agencies claim that the BRI will eventually absorb between $4 trillion and $8 trillion.

But what are the benefits and risks for countries accepting BRI-linked financing to build transport and energy infrastructure?

To this day, the BRI remains a patchwork of projects without a well-articulated strategy backed by solid analysis of the potential benefits for China and countries that will borrow from Chinese entities to finance large infrastructure projects. This is critical if the politically less-than-stable countries in Central and South Asia with a poor track record of sound policymaking are to benefit from BRI. In order to service BRI loans, the investment in transport and energy infrastructures plus any associated technology transfer must attract private investment in tradable goods and services and increase export earnings from exports.[1] Whether such a virtuous spiral of investment and exports will ensue, is far from certain. Moreover, infrastructure building and mining on the scale envisaged could lead to severe environmental degradation absent the enforcement of strict regulations, which are either not in place or enforced with a light touch.

There are other reasons for proceeding cautiously down the Belt and Road. The terms and conditions of loans extended by Chinese entities are less than transparent. Furthermore, the governance and finances of the more than 50 Chinese state-owned enterprises that are responsible for major BRI projects are opaque, and their capacity to manage and implement complex transnational projects is untested. Contractual relations with such entities could prove to be tendentious if projects fail, the quality of work and materials is poor, or if lax environmental standards cause damage. The Tharparkar project in Pakistan is a case in point.

This context elicits the following questions and concerns that deserve closer attention and more systematic study.

Can China finance BRI projects to the tune of several trillion dollars from its own resources? And if not, will China need to tap the international bond market for the bulk of the financing? By doing so, its indebtedness would increase and it would absorb considerable risk associated with lending for long-term projects in countries such as Uzbekistan, Pakistan, Sri Lanka, and Laos. In the end, given the current state of China’s forex reserves, will the outlay on BRI be an affordable but not game changing $25 billion per year?

China’s neighbors worry that the purpose of BRI infrastructure and connectivity is to further Chinese exports and geopolitical ambitions. Many are already on the slippery slope to deindustrialization and BRI could accelerate the process. Existing light consumer manufacturing would be imperiled and the likelihood of diversifying into more complex products would be greatly diminished because of China’s competitive advantage in a wide range of manufactures.

European experience suggests that cross-border transport infrastructure has not led to regional convergence. If anything, it has tended to increase regional disparities by making existing hubs more dominant and disadvantaging nearby regions in the hubs’ shadow. Rail links between Milan and Naples have strengthened hub economies while contributing little to the development of Southern Italy. A study of road infrastructure building in Portugal came to similar negative conclusions: greater accessibility did not improve the cohesion and purchasing power of less developed parts of the country.

To service loans from China and other borrowers, countries on the receiving end of infrastructure investment will need to greatly expand their exports and run trade and current account surpluses. Given recent trends in manufacturing and slower growth of world merchandise trade, is that likely? In 2016, China ran a trade surplus amounting to $250 billion with participants in the BRI. Could countries such as Pakistan (which runs a $13 billion trade deficit with China) possibly narrow and reverse the trade gap and run surpluses with its hyper competitive neighbor?[2] If they do not, what is the return to these countries in the form of long term gains from infrastructure? In other words, how much growth could BRI projects unlock by way of tradable goods and services? Furthermore, if highly indebted countries are unable to repay these loans, what are the consequences for Chinese firms and for their bankers?[3] Taking over assets that will need to be marked down would involve absorbing large losses.

What is the risk of BRI exacerbating the resource curse in countries such as Kazakhstan, Turkmenistan, and Afghanistan? Could the creation of the BRI trade corridor render them even more resource dependent and stunt their non-resource based tradable sectors?

So far, China’s projects in its own Western provinces have at best yielded modest returns. The profitability of China’s foreign direct investment in developing countries has also been low. This suggests that the cross-national infrastructure projects intrinsic to BRI will be costly to build and the financial returns are likely to be meager, at least in the medium term. Political changes in destination countries could easily affect project outcomes. Political risk could discourage participation by investors from developed countries.

Geopolitical issues need to be factored in. China’s actions have alarmed some of its neighbors – India in particular.[4]  Chinese closeness to and support for Pakistan could contribute to continuing friction between Pakistan and India. Political tensions within and among countries, sporadic violence (as in Pakistan’s Baluchistan Province), and arms races in South, Southeast, and East Asia may undermine the BRI – as will continuing discord in the Middle East. How might these developments and others affect growth prospects is a key question.

Shahid Yusuf is Chief Economist of the Growth Dialogue at George Washington University and an adjunct professor at Johns Hopkins University.

Note: The views expressed in this article are the author’s and do not necessarily represent those of Pakistan’s Growth Story.

[1] Premier Li Keqiang referred to technology transfer as China’s, “golden business card”. Financial Times (2017, July 18th p.9).
[2] Between 2006/7 and 2015/16, Pakistan’s exports to China went from $575 billion to $1.63 billion. Meanwhile China’s exports to Pakistan increased from $3.5 billion to $12.1 billion (Source: http://fp.brecorder.com/2017/03/20170314153866/). Figures in the Financial Times indicate that China’s exports amounted to $16.5 billion in 2015.
[3] Down the road, servicing the loans from China will be burdensome for many countries. Chinese firms have already encountered problems with projects in Myanmar, Sri Lanka and Indonesia. Chinese SOEs that are spearheading BRI, such as the China Railway Corporation, are themselves increasingly in debt to Chinese banks – CRC’s debts amount to $558 billion and these are rising largely because much of China’s 22,000 high-speed rail network runs at a loss (Source: https://www.ft.com/content/9a4aab54-624d-11e7-8814-0ac7eb84e5f1?mhq5j=e3, https://www.ft.com/content/156da902-354f-11e7-bce4-9023f8c0fd2e?mhq5j=e3).
[4] In response to BRI and disputes along its northern border with China have induced India to launch its own initiative extending from Africa to Southeast Asia variously called the “Spice Route” the “Blue Revolution” and SAGAR – “Security and Growth for all in the Region”. India is also investing $300 million to lease the 2,000 acre tract of land which is the site of the largely deserted Mattala Rajapaksa Airport adjacent to Hambantota Port in Sri Lanka in order to prevent a Chinese takeover of the facility and to control China’s access to the port that it has leased for 99 years (Source: http://www.businessinsider.com/india-and-china-are-fighting-for-control-in-sri-lanka-2017-12, https://www.reuters.com/article/us-sri-lanka-port-india/india-eyes-airport-in-sri-lanka-near-chinese-belt-and-road-outpost-idUSKBN1CI0KI).

Understanding Punjab’s rural non-farm economy

RNFEconomy

Usman Naeem

Where is Pakistan’s growing labor force going to find jobs? Many argue that, given the limits of arable land, agriculture cannot create much new employment, pushing job-seekers to cities. However, just because future job growth may not be agricultural, that doesn’t mean it won’t be rural. This is because of the rural non-farm (RNF) economy, which has the potential to absorb a large part of the labor force, slow migration to already congested cities, add to GDP, and alleviate poverty and inequality.

The RNF economy has been neglected by policymakers because few understand the sector and its role in development. That is not surprising given the dearth of research on RNF activity in Pakistan.

To fill this knowledge gap, the most rigorous evidence on Punjab’s RNF economy has been digitized by the International Growth Centre (IGC).[1] The IGC project is based on a census of small and cottage industry in Punjab that was conducted by the Punjab Small Industries Corporation[2] (PSIC) from 2011 to 2013. Following strict protocols[3], data for 352 unique activities covering 24,210 rural clusters (villages)[4] in 36 districts of Punjab was recorded.

The PSIC survey reveals important data to understand RNF activity in Punjab, where 63 percent of the population now live in rural areas. Following is a brief overview of the most important data.

Dividing Punjab into North, Center, South, and West regions based on the classification adopted by Cheema, Khalid and Patnam (2008), the project revealed significant regional differences in the kinds of economic activity found in villages. These differences can be explained by historical variation in the economy, agrarian structure, road and irrigation infrastructure, human development, and other factors that distinguish these regions.

Table 1 reports the average per cluster of different types of RNF activity at the level of Punjab and regions.

Table 1: Snapshot of the non-farm economic activities at Punjab and regional levels


Region
Total clusters Average per cluster
Structu-res
House
holds
NDUs NDUs*: Non-farm economic activity NDUs
Manufa-
c
turing
Trade Personal services Others Rest**
Punjab 24049 430.84 426.43 61.89 3.83 19.95 7.54 4.26 26.31
North 2309 394.36 377.34 35.96 2.28 15.06 5.9 3.54 9.18
Center 11961 435.75 428.13 70.4 3.99 19.64 6.98 4.43 35.35
West 4094 402.57 461.58 53.03 5.03 20.62 7.55 4.26 15.56
South 5685 455.69 417.46 60.92 3.26 22.11 9.39 4.19 21.97

* Non-dwelling units (NDU’s) were units that were being used for non-residential purposes, i.e., for economic and non-economic activities.
** This includes farm and non-economic activities and those that were unidentified because of incomplete or illegible information.

The PSIC data not only shows the kind of RNF activity, but also the intensity of it. The intensity of economic activity (IEA) in villages, defined as the number of non-farm economic activities in a village per 100 households, is mapped at the district level in Figure 1:

Figure 1: Average intensity of non-farm economic activity in a village by district

IEAPunjab

IEA is low in the North region, high in four out of the seven districts in the West region, high in all but one district in the South region (with the exception of D. G. Khan), and it varies from high to medium in the Centre region.

We then looked at how the seven most important categories of RNF activity were distributed regionally, as shown in Table 2:

Table 2: Main non-farm economic activities in percentage by region

Region
Non-farm economic activities’ categories North Centre West South
Retail Food/ Beverages 35.93 41.66 38.6 39.89
Other Retail 15.05 11.97 7.95 7.6
Household Goods and Home Appliances 6.65 7.27 7.83 8.29
Miscellaneous Services 13.27 10.15 10.89 12.58
Social Services 9.59 11.21 9.44 8.76
Wholesale 4.57 4.23 7.49 5.15
Motor Vehicles Related Activities 5.87 6.37 8.82 8.54
Activities not included above 9.07 7.13 8.97 9.2

Going forward, researchers should use the data set to answer a broader set of questions for this sector. Policy research stemming from this will act as a tool for policymakers to understand and subsequently tap into the true potential of Punjab’s RNF economy.

The data set is available upon request at igc.pakistan@theigc.org. Anyone wanting access to the data set should send in a request with his or her name, title, organization and a brief write-up on the proposed research, to the above address.

Usman Naeem is a Pakistan Country Economist at the International Growth Centre.

[1] This post is based on the IGC-funded project, ‘Development of an electronic database of Industrial and Commercial Activity and a Spatial Analysis of Small and Cottage Industries in Punjab, Pakistan’, the research team on which included Syed M. Hasan, Attique ur Rehman, Ijaz Nabi, Naved Hamid, and Usman Naeem.

[2] PSIC is an affiliated organization of the Industries, Commerce and Investment Department (IC&ID) with a mandate to “promote sustained industrial development through provision of market driven credit, infrastructure and technological support to contribute towards poverty alleviation through job creation and socioeconomic uplift of the province”.

[3] Data was only entered for rural clusters in Punjab, and in order to ensure quality, the data was entered in-house and under the direct supervision of the research team. In order to minimize subjectivity, a macro-enabled excel-based data entry system was designed that automated much of the data entry operations. In addition, three Stata programs were also written for improved data entry management and quality assurance.

[4] This consists of Mouzas (villages), which are the smallest revenue units recognized by the unique Hadbast number, within a Tehsil (an administrative sub-division of a district). There are a total of 25,914 Mouzas or rural clusters in Punjab.

How should we think about Pakistan’s middle class?

gettyimages-102008417-event

By Shehryar Nabi

Pakistan’s expanding, largely urban middle class shows a country far different from its traditional poles of poor and elite.

How should we understand Pakistan’s middle class – a phenomenon inseparable from its economic and political future?

On October 31st, the Lahore-based Consortium for Development Policy Research co-organized an event with the Urban Institute in Washington D.C. to assess this question. The event featured a panel of researchers studying middle class trends both globally and in Pakistan.

Here are key takeaways from the conversation:

We know the middle class is growing, but it remains ill-defined

There is plenty of anecdotal evidence of the middle class in Pakistan. Go to any major city, and you will see consumerist lifestyles that, as described by World Bank Economist Ghazala Mansuri at the event, are free from the depravations of poverty but still depend on public services that the rich opt-out of.

But how big is the middle class in numbers?

There are two government sources used to size up Pakistan’s middle class: National income accounts and household consumption surveys. Combining these measures, and using the global middle class definition of $11 to $110 in daily income[1], Brookings Institution Senior Fellow Homi Kharas found that about 50 million Pakistanis are middle class, comprising 27 percent of the population. By 2030, that number is forecast to reach 160 million people, 66 percent of its population. That would make it the 13th largest middle class in the world.[2]

Mansuri commented that economic definitions of the middle class can vary wildly, making these figures imprecise. But existing measures at least confirm that Pakistan’s transition to a middle class society is in full swing.

How the middle class changes society

The rise of Pakistan’s middle class has broad implications for society, detailed at the event by Homi Kharas.

Firstly, the rise of the middle class has a varied effect on climate change. On the one hand, a growing middle class exacerbates climate change by increasing overall consumption, and thus carbon emissions. On the other hand, the middle class tends to be educated and live in smaller households, both of which are associated with lower carbon footprints.

The middle class also has an important effect on population growth. Pakistan’s fertility rate has been declining since the 1980s, and a growing middle class is likely to slow down population growth even more. If this is indeed the case, then the projection of the middle class described above would be too high because it does not account for a lower fertility rate.

Demand for education, the surest pathway for moving up the socioeconomic ladder, is driven up by the middle class.

Will the middle class strengthen democratic institutions? Kharas remarked that global experience suggests that rising prosperity and authoritarian government are by no means mutually exclusive. Nor are existing democratic institutions necessarily safeguarded by the middle class.

Kharas observed that because the middle class tends to demand public services, political tensions can stem from service delivery failures that spark distrust in the government. The evidence on this is in Pakistan mixed. A recent survey in Lahore shows that public service delivery is high on the minds of voters. Yet despite public service delivery failures – which Ghazala Mansuri pointed out have remained especially dire in Karachi despite a growing middle class – the expected political reaction has not been pronounced. This suggests that the middle class is not mobilized to demand accountability for service delivery through the political system.

The rise of the middle class does not guarantee gender equality

There are intuitive reasons why a rising middle class anticipates better outcomes for women. Middle class incomes may be driven by women earners in the family, increasing demand for their education, and in effect empowering them to make choices beyond the constraints of patriarchal norms.

But the evidence from Pakistan shows the path to empowerment is not so straightforward.

Drawing on data from 2005 to 2015, Urban Institute Research Associate Reehana Raza first pointed to trends that suggest a positive impact of middle class growth on women’s empowerment. In urban areas, which are strongly associated with the middle class, women’s enrollment in secondary education increased by 10 percent. Women’s enrollment in tertiary education grew from 200,000 to 600,000. Raza also found that income returns for each additional year of schooling are higher for women than for men.

However, this isn’t translating into substantial gains in employment. Although women’s employment is on an upward trend, only 25 percent participate in the labor market. Just 20 percent of women with a bachelor’s degree enter the labor market. Women who seek employment tend to do so after receiving at least ten years of schooling, whereas men can find work at any level of education. Raza concluded that while high income returns demonstrate an opportunity for women to benefit from education, it isn’t being reflected in Pakistan’s workforce.

Does the middle class increase women’s political representation? According to ongoing research in Lahore led by Ali Cheema, Senior Research Fellow at the Institute of Development and Economic Alternatives, the gender gap between men and women’s votes remains high in urban areas where the middle class has grown. Ali Cheema discussed what his research shows about the gender gap at the event.

One theory is that patriarchal norms at the household deny women their right to vote, or their votes are decided for them. But Cheema’s team found a different story. Women are in fact not prohibited from voting, and voting decisions are largely their own. They also found that divergences in women and men’s votes can have important consequences for electoral outcomes.

A different explanation offered by Cheema is the persistence of patriarchal norms at the party level. Cheema’s team found that party organizers and the movements they build are overwhelmingly male. This suggests they are unengaged with potential women voters.

Surveys conducted earlier this year by Cheema’s team show that women feel invisible to political parties, leaving them unenthusiastic about elections. Women are 21 percent more likely than their male counterparts to strongly agree that political parties are only interested in men’s votes.

Cheema argued that to reduce the gender gap in voter turnout, there needs to be a greater focus on the exclusionary tendencies of existing political structures even where the middle class is growing.

What we need to sustain middle class growth

Pakistan’s middle class surge is not inevitable if economic, social, and political structures remain as they are. At the event, ways to ensure the middle class’s continued expansion were floated with the audience for discussion.

Homi Kharas argued that the future of middle class jobs will not be in the manufacturing sector, the conventional pathway from lower to middle-income country status. Rather it will be in services – education, health, banking, telecommunications, etc. Kharas highlighted that the dynamism of the services sector creates wide opportunities in the job market. However, services will have to be tradable to drive middle class growth. Right now, however, Pakistan does not have internationally competitive services other than migrant labor.

A neglected avenue of middle class growth, Ghazala Mansuri argued, is agriculture. Mansuri stressed that the largely urban phenomenon of the middle class should not lead to the neglect of rural areas, which currently suffer from low productivity and poor service delivery.

The final, but highly important priority emphasized by Kharas is increasing women’s employment. Pakistan’s middle class is exceptional in how few women enter the labor market. For other middle-income countries, like China and Malaysia, incorporating women into the workforce was pivotal for overcoming widespread poverty and raising living standards. Unless social and structural barriers that prevent women’s labor force participation are removed, sustaining Pakistan’s middle class will be a challenge.

Shehryar Nabi is a communications associate at the Consortium for Development Policy Research.

[1] However, middle class trends have been observed among Pakistanis earning $5 to $10 per day.

[2] Kharas added a big caveat to his methodology. If you judged Pakistan’s by its national income accounts, it would be slightly richer than Bangladesh. But if you just looked at household consumption surveys, which do not account for 60 percent of national income, Pakistan would be poorer than Kenya or Cameroon. Household surveys fall short because questionnaires miss several modes of consumption, omit the informal sector, and are often unanswered by the top 10 percent.  

Why a grant to help people migrate during seasonal hardship could be a game changer

RangpurAgriculture

By Agha Ali Akram

Estimated conservatively, half of the world’s 600 million food insecure people who live in rural areas suffer from seasonal hunger during the “lean season”, the period of the agricultural cycle between planting and harvest when there is less work. As much as 50 percent of Pakistan’s population is food insecure, and while there are no specific estimates, it is likely that Pakistan’s large agriculture sector – which employs 45 percent of its workforce – is vulnerable to seasonal deprivation.

Could offering residents of rural areas a small travel grant to temporarily migrate alleviate their suffering? In a recent study¹ Mushfiq Mobarak (Yale University), Shyamal Chowdhury (University of Sydney), and I conducted in Bangladesh, we show that travel grants targeting the landless improve their own welfare and benefit rural village economies in the midst of seasonal deprivation.

Seasonal food insecurity in Rangpur and a potential solution

Every year, September ushers in a three-month lean season for landless farmers living in Rangpur, a region in the northwest of Bangladesh. Agricultural work dries up and the landless lose their source of income. And since they do not own property, they are unable to grow enough of their own food. This sets off a period of considerable hardship.

Small travel grants to temporarily leave the region and find work in nearby urban areas that are not affected by the lean season show promise as a solution. Gharad Bryan and my co-authors previously tested this idea and found that grantees increased both consumption and caloric intake. They also migrated during the subsequent lean season without being offered a travel grant. The small travel grant reduced the risk households associated with temporary migration and opened a highly profitable opportunity for them.

Studying spillovers: What we did differently

Given these results, we wondered if the consequences of temporary migration were “spilling over” to villages of origin. For instance, migration might create a relative scarcity of labor for village employers, driving up local wages and benefiting landless workers who stay back. Conversely, if non-migrants and migrants have a complimentary relationship – that is, non-migrants depend on migrants to find work – then migration would hurt the rural economy as non-migrant productivity would drop.

To measure these potential spillovers, we built on Bryan et. al in our own study by varying the amount of travel grants offered to landless workers. In 47 “high-intensity” villages, we offered 70 percent of landless residents a grant, while in 48 “low-intensity” villages we offered 14 percent of landless residents a grant (for a total of 5,792 offers made across the two treatment groups). 38 other villages were assigned to a control group, in which no one was offered a grant.

This variation in the intensity of travel grant offers allowed us to understand the spillovers of migration. The higher the migration rate, the greater the potential impacts on the local village economy.

The travel grant scheme was coupled with extensive surveys. We surveyed both households that were offered the grant and those that were not offered. Surveying households that were not offered allowed us to detect whether a migration opportunity they could not access benefitted them nonetheless. We also surveyed employers in all our villages to understand wage and other demand-side impacts. Finally, we repeated the household and employer surveys in the subsequent lean season. Our surveys sampled 3,600 households and 1,099 employers across control and treatment villages.

The results

First, we find that grantees were much more likely to migrate and find work in nearby cities. Due to this increase, migrants in the high-intensity group increased their total income by 20 percent from working in destination cities.

Next, more strikingly, we find that those offered the travel grant in high-intensity villages were twice as likely to migrate than those in low-intensity villages, suggesting that people are more likely to migrate if more people around them are also likely to migrate. In fact, we also find that landless workers not offered the grant were more likely to migrate in high-intensity villages, which suggests that just knowing people who are likely to migrate can increase one’s own likelihood of migrating without needing any subsidization. This is important. A program built around a travel grant like ours could save costs because not everyone needs to be subsidized.

Moreover, under the assumption that rural labor markets are not well integrated (i.e. the village is the relevant labor market), we also find that the local agricultural wage rate increases. In our high-intensity villages, more than half of the local landless population migrate away because of the travel grant we offer, “emptying out” the local labor market. This bids the origin village wage rate up, as reported by employers in our survey work, since there is relative labor scarcity.

Migrant workers take advantage of this increased wage rate by supplying more labor in the origin village labor market too. They do this by migrating back and forth between their origin village and destination over the course of the lean season. Because so many people do this, there is slack in the village labor market that landless workers can take advantage of. Where previously village labor markets had few opportunities for paid work, there were now relatively more opportunities available. This is good news for landless workers as they can take advantage of opportunities both in the city to which they temporarily migrate and their own village.

Policy implications and the bigger picture

Our results point to a new and cost-effective policy option to improve rural welfare and address the terrible suffering caused by seasonal deprivation. With a small travel grant, many landless rural workers can temporarily migrate and benefit from work opportunities in cities. A key insight from our study is that a seasonal migration grant policy at scale would potentially benefit the rural economy since it bids up the local agricultural wage and allows previously unemployed workers to find opportunities. And any program that uses travel grants would not need to be offered to all landless workers because those not offered a grant also migrate, suggesting that there is an optimal level of coverage below 100 percent.

Additionally, our findings point the way to a policy that can complement existing rural development programs. Typically, rural development policy efforts focus on developing human and physical capital by providing very direct financial and material support to the rural sector through rural support programs (Pakistan has at least 11 major rural support programs). The seasonal migration travel grant provides an innovative and scalable solution to add to the existing set of rural support programs. In fact, rural support programs provide a natural vehicle to scale the travel grant, adding it to their programming.

Finally, the travel grant has potential for impact if applied to other kinds deprivation. For example, the deaths, water shortages, and loss of livelihood brought on by seasonal drought in Pakistan’s Thar region could be ameliorated if residents had access to a travel grant. Given the inherent unpredictability of disasters, mobilizing resources could be challenging but is well within the realm of possibility.

Agha Ali Akram is an environmental economist who recently completed a fellowship at Yale University’s School of Forestry and Environmental Studies. He holds a PhD in Environmental Economics from Yale University.

[1] This links to a summary of the paper, which is being readied for publication at the time of writing.