Now that provinces have more control over taxes, do they collect more revenue?

income tax pic

By Ghazan Jamal

The 18th Amendment to the Constitution and the 7th National Finance Commission (NFC) award supporting it give the provinces greater control over their fiscal affairs, but has that increased revenue collection? This post compares how Sindh, Punjab, and Khyber Pakhtunkhwa (KP) have raised tax revenue following devolution.

Pakistan’s tax-to-GDP ratio in 2016 stood at 12 percent. According to a recent paper by the IMF, this represents an encouraging increase over the previous three years. As good as that sounds, Pakistan still lags behind other emerging market economies in terms of tax to GDP ratio.[1] Poor tax collection by provinces is an important factor in Pakistan’s overall unsatisfactory tax effort.

The provinces can collect taxes on agriculture, property, automobiles, services, and stamps. However, they continue to depend largely on transfers from the federal government. Based on revised budget estimates for fiscal year (FY) 2015-16, federal tax receipts accounted for 76 percent of the total general revenue in Sindh, 78 percent in Punjab and a staggering 92 percent in KP. Of the total tax revenue in Pakistan, provincial tax collection only accounted for 7.7 percent in 2016 – a meager 0.3 percent of Pakistan’s GDP. This is partially explained by the fact that the two most buoyant avenues of taxation – income tax and general sales tax (GST) on goods – remain with the federal government.

While it appears that devolution has galvanized the provinces to promote social sector development, like in health and education, the increased share of the provinces in the NFC award (as a step towards fiscal decentralization) seems to have limited the incentive of provinces to increase their own revenue generation, since they now receive more funds from the federal government. So what exactly is happening with provincial tax levels since devolution?

Figure 1 below shows the provincial revenue trend for the three provinces starting from FY 2010-11 (the year devolution occurred), till FY 2014-2015, for which the latest actual figures are available.

TaxRevenuePunjabSindhKP

In FY 2010-11 Punjab managed to collect about PKR 66 billion in provincial taxes while for the same period Sindh collected PKR 42 billion.  The KP government at the time, led by the Awami National Party (ANP), only managed about PKR 3.5 billion. Such low numbers can partly be explained by a two-year tax exemption given by the KP government because of the negative impact of militancy and floods on the business community of KP.

Remarkably, in comparison, Sindh increased its provincial tax revenue to about PKR 96 billion by 2015, a 126 percent increase. However, as explained later, this was primarily achieved through a special tax on imports levied by the Sindh government. On the other hand, KP under Pakistan Tehreek-e-Insaaf (PTI) has been able to take provincial tax receipts to a little over PKR 11 billion by 2015, a 228 percent increase. The big jump came in 2012-13 when provincial tax revenue almost doubled from PKR 3.6 billion in the previous year to PKR 7.4 billion primarily as a result of ending the tax break given two years ago. This was in the ANP government’s last year in office. PTI in its first full year continued with this sharp increase, taking provincial tax revenue to a little over PKR 10 billion. However, between 2014 and 2015 there was a moderate increase of slightly more than PKR 1 billion. Overall, KP still lags behind in revenue collection and continues to depend more heavily on federal transfers compared to the other two provinces.

Similar to the federal level, indirect taxes – specifically general sales tax (GST) on services – remains the main contributor to provincial tax revenue. In 2015, direct taxes only contributed a little over 20 percent in both KP and Punjab. While in Sindh it contributed less than 7 percent of all provincial tax receipts for the province.

In KP, GST on services accounted for 56 percent of the total provincial taxes in 2015. Although KP’s tax on agriculture has increased from PKR 20 million in 2012 to PKR 66 million in 2015, its share remains worryingly low. In the case of Punjab, GST on services contributes about 44 percent of the total provincial tax revenue. Interestingly, stamp duty is also a significant contributor to provincial taxes in Punjab, about 22 percent, unlike in the other two provinces. However, even in Punjab agriculture tax contribution is minuscule, contributing PKR 762 million in 2012 and by 2015 reaching the PKR 1 billion mark, which constitutes barely one percent of the provincial tax revenue for that year.

Similar to KP and Punjab, in Sindh GST on services is the largest contributor to provincial tax, contributing about 52 percent. However, the Sindh government, taking advantage of being Pakistan’s main port of entry for goods, charges a Sindh Development and Maintenance of Infra-Structure cess on imports coming into Sindh by air or sea. Its contribution is another 26 percent to the province’s tax revenue in 2015. Other provinces have raised concerns over this form of taxation pointing towards Sindh taxing goods that are meant for other provinces. The share of tax from agriculture is even lower in comparison to the other two provinces; it stands at a mere 0.3 percent of the total tax revenue.

Contrary to popular belief, the absolute Rupee value of tax collection by the provinces actually increased in recent years. However, the provinces still only contribute less than 8 percent of all tax revenue. This means there is still a lot of room for all three provinces to improve their tax collection. However, care must be taken not to implement taxes that distort the cost structure of firms (as in the case of Sindh’s cess, and the provincial tax on internet services) and are growth inhibiting and/or increase the burden of income taxation on those who already pay taxes (as in the case of Punjab’s tax on some services). While improving their tax effort, provinces must also avoid taxes that are regressive, as seen in the tax on cellular phone services.

Ghazan Jamal is a Pakistan Country Economist at the International Growth Centre. 

How well represented are women in Pakistan’s rural volunteer organizations?

WomenVolunteerOrganizations_Public.jpg

By Hamna Ahmed, Asha Gul, Saheem Khizar, Simon Quinn, and Kate Vyborny

Since the 1980s, Pakistan has followed a unique model of social mobilization that has contributed greatly towards rural development and poverty alleviation. This model of social mobilization and community participation involves setting up local community organizations at the neighborhood, village and union council (UC) levels. These organizations comprise local volunteer citizens and are run like small firms with elected management bodies. Rather than address a single issue, they strive for overall community development and undertake activities in several sectors including health, education, microcredit, agriculture, infrastructure, disaster management, and conflict resolution.

The Pakistan Poverty Alleviation Fund (PPAF) is the apex institution managing this social mobilization process with support from local partner organizations (POs). A joint research team from the Lahore School of Economics, Oxford University, and Duke University is collaborating with PPAF to study these volunteer organizations and how they can be supported to better represent their communities and improve their activities. In the fall of 2014, the team conducted a baseline survey of 850 volunteer organizations formed at the UC level. These organizations are referred to as Local Support Organizations (LSOs) or Third Tier Organizations (TTOs). The survey gathered data through meetings with each organization’s executive body (EB) on  their governance, activities, future plans and characteristics of the EB members.

Data on village characteristics and organization activity for every village  were also collected from one local contact in every UC. In a randomly-selected subset of 150 UCs, a representative sample of households was interviewed to gather data on perceptions about these volunteer organizations and household-level assistance received from them. Based on this data, we found that women both benefit from and are actively involved in the governance and decision-making process of these organizations.

The main findings are as follows:

Women’s representation varies greatly. About 25 percent of the volunteer organizations have all-female EBs, while just under 20 percent of these organizations have all male EBs, with the rest having mixed-gender EBs. Gilgit-Baltistan and Kashmir have mixed-gender organizations with a significant women’s representation. Almost 90 percent have at least one woman on the EB, while half have at least 25 percent female EB representation (Figure 1). Khyber-Pakhtunkhwa and Balochistan – traditionally socially conservative provinces –have much less women’s representation, with more than 40 percent of organizations with no women on the EB. In Punjab and Sindh there are many volunteer organizations with only women on the EB, in part reflecting deliberate efforts by PPAF and POs in these provinces to organize women’s-only volunteer organizations in recent years.

Figure 1

WomensRepEBRegion.jpg

Women are less active than men in governance. Women are less likely to attend EB meetings and speak less frequently when they do attend. In mixed-gender organizations, women are less represented in office than men, especially in leadership roles. At the lower management level (i.e. the general body), attendance is equally high for men and women. This likely reflects the lower commitment level required for participation in general body meetings, which occur much less frequently.

Women are more active in organizations where they form the majority. In organizations where women form the majority, the female EB members are much more likely to attend, and more likely to speak. More women in majority-female mixed volunteer organizations hold office. The greater participation of women in environments where they are more concentrated may simply reflect local culture: women in more progressive UCs are more likely to join the volunteer organization, and are also more vocal. It might also be the case that women EB members feel more confident expressing themselves and contesting office when there are more women in the group.

Women EB members come from similar or poorer households than their male counterparts. It is thought that for a woman to be represented, she must have some compensating advantage. This suggests women in volunteer organizations are mostly from wealthier households. But we do not find evidence for this. Women EB members are just as likely to live in mud-brick houses as male EB members, and in fact are more likely in Sindh and Balochistan.

Organizations with more women are less well known in the community. Based on the evidence from the household survey conducted in the UCs, organizations with the most women tend to be least well known in their communities – even among female respondents. This surprising finding might suggest that even women in leadership roles in rural Pakistan are less able than men to effectively promote their organizations’ work publicly.

Practical constraints limit regular participation, especially for women. Significant numbers of both men and women EB members report difficulty attending due to work and transport issues, but more women report difficulties overall. Transport issues are the leading cause of difficulty for women, and are reported much more frequently than domestic responsibilities or issues with obtaining permission for leaving the village (Figure 2).

Figure 2

DifficultiesAttendingMeetings.jpg

Local volunteer organizations tend to be more inclusive of women (and girls) as beneficiaries than in their governance. For almost 90 percent of volunteer organizations, women comprise at least 25 percent of their direct beneficiaries. Around 45 percent have a majority of women as their beneficiaries (Figure 3). The regional patterns of beneficiaries match gender representation in governance: the activities of organizations based in KP and Balochistan tend to directly benefit men more, while activities in Punjab and Sindh are more directed towards women (Figure 4). Microcredit and livelihoods programs are most heavily targeted at women, which in part is because of rules imposed by PPAF itself. Agriculture, dispute resolution and sporting/cultural activities more often target men.

Figure 3

GenderDirectBeneficiariesLSO.jpg

Figure 4

GenderDirectBeneficiariesLSORegion.jpg

Local volunteer organizations with more women in governance do more work targeted at women. Local volunteer organizations with more women on their EBs have more women as direct beneficiaries (Figure 5). Part of this occurs through project choice. EBs with more women’s involvement are also more active in health, education, microcredit, livelihoods, and human and legal rights. Those with only men’s involvement are more involved in infrastructure, sporting, cultural, and entertainment activities.

Figure 5

GenderLSOGovernanceActivities.jpg

Figure 6

GenderDirectBeneficiariesLSOActivity.jpg

These findings provide a useful, detailed snapshot of the level of women’s inclusion in volunteer community organizations formed at the UC level across the country. However, these findings do not imply causal relationships that are important for policy making. For example, we know that organizations with more women on the EB serve more women beneficiaries, but we do not know whether encouraging EBs to include more women would necessarily increase the number of women beneficiaries.

An ongoing research project will help address these and other questions useful for engaging PPAF with TTOs. Through a randomized control trial, organizations in treatment groups are asked to submit regular reports on either active participation of women in EBs and general bodies, or on the women beneficiaries of their activities. Some volunteer organizations will be offered the opportunity to be publicly recognized if they improve the most in terms of women’s inclusion and other performance measures. The findings from this research will hopefully help guide PPAF practices in the future, build on the existing foundation of TTO organization and achievements, and better serve some of the poorest communities in Pakistan.

Hamna Ahmed is a a faculty member at the Lahore School of Economics and PhD candidate in Economics at the University of Kent

Asha Gul is a PhD candidate in Economics at the University of New South Wales.

Saheem Khizar is a field experiment coordinator at the Pakistan Poverty Alleviation Fund.

Simon Quinn is an associate professor of Economics at Oxford University.

Kate Vyobrny is a post-doctoral fellow at Duke University. 

What the government is (and isn’t) doing to fix urban issues

UrbanPakistan_JimC_CCBY-NC2
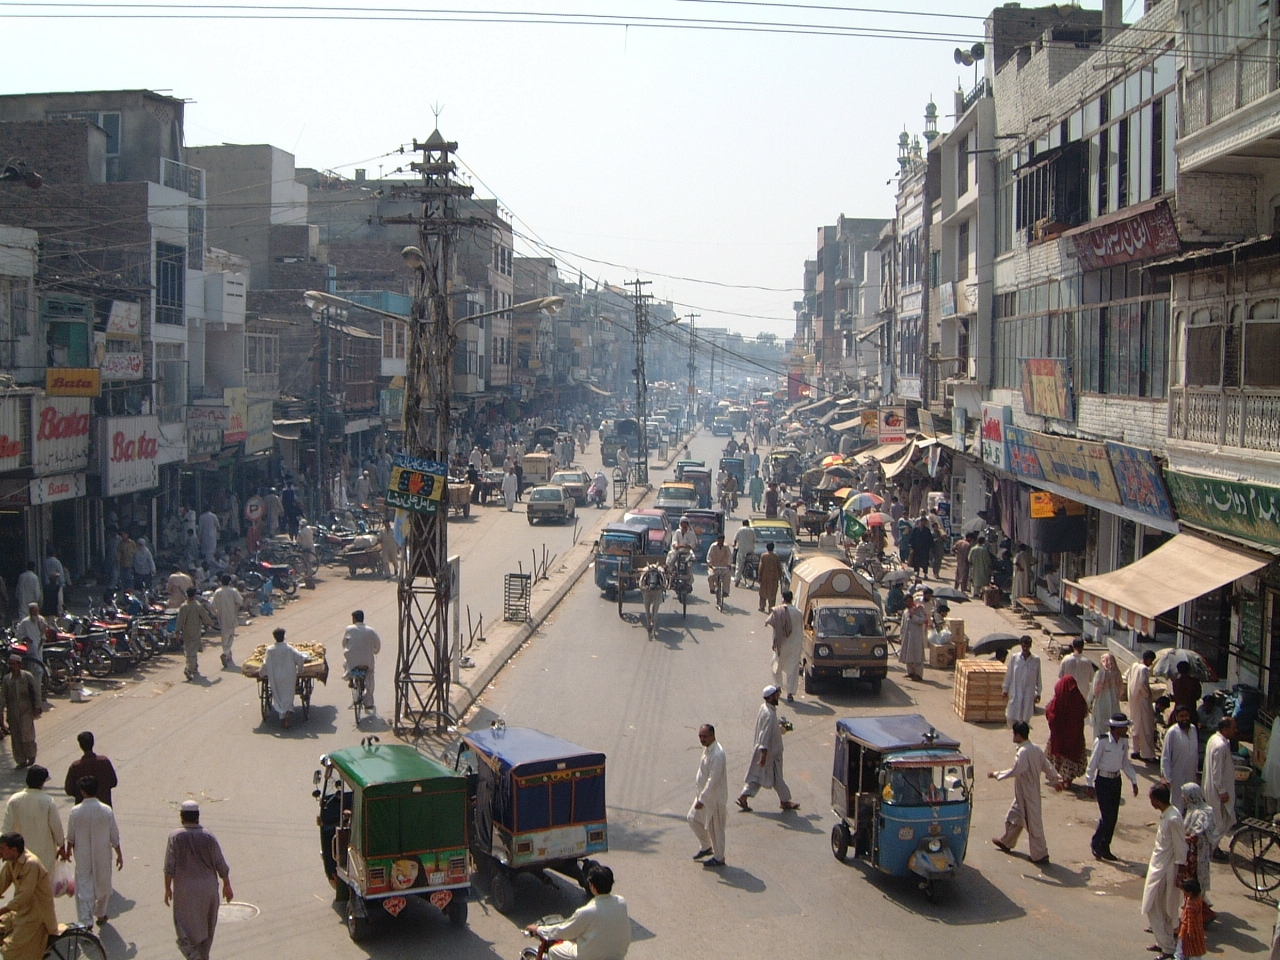
(Credit: JimC, CC BY-NC 2.0)

By Ijaz Nabi and Hina Shaikh

What is the government currently doing about Pakistan’s staggering urban challenges? Where is more work needed? Here is an overview per issue:

Housing

Pakistan faces a growing housing shortfall of approximately 4.4 million units. When provided, the quality is often substandard and low income groups receive little benefit. To redress chronic housing problems, Pakistan’s only housing policy was announced in 2002. The government’s attempt in 2005 to update the housing plan with a comprehensive policy framework remains unexecuted. Until a new, official policy is adopted and implemented, the provision of low-cost urban housing will be an elusive goal.

Local governments have a limited role in resolving the urban housing crisis. They have little control over urban land[1], a lack resources to fund schemes and are unable to borrow independently from international donors.

Many announcements of government-sponsored housing projects have made headlines (such as Ashiana[2] and Apna Ghar[3]) but remain uncompleted. The Housing and Works Ministry openly admits its failure to complete various projects. Most face bureaucratic and or administrative delays or are mired by corruption scandals and lack of political will. Where construction has taken place, low income groups have received little attention.[4] To complete one housing project, Punjab is now seeking assistance from TOKI – the Turkish Housing Development Administration. Punjab also plans to sell public land to fund low-cost housing. Several schemes are underway in Khyber Pakhtunkhwa (KP) and Sindh as well but progress is slow.

The House Building Finance Company (HBFC) decided in October to extend housing finance to low and middle-income groups by introducing a new priority lending scheme. The State Bank of Pakistan has issued guidelines for housing finance. Donors like the World Bank are also stepping in to help launch innovative housing products targeting under-served communities. While partial attempts like these have been made to address housing problems,,  chronic housing shortages and poor quality remain unaddressed.

Water and Sanitation

In most Pakistani cities, water supply is limited and unsafe for drinking while access to waste management services remains poor.

A National Drinking Water Policy was announced in 2009 that promises safe and sustainable drinking water to all by 2025, and a Sanitation Policy was declared in 2006 aligning goals with the relevant Millennium Development Goal targets. Provincial commitment to ensuring water and sanitation services are formalized is seen in WASH[5] sector plans in Punjab and Baluchistan[6], sectoral roadmaps in Punjab[7] and other policy initiatives[8].

Initiatives have also been announced to improve waste disposal in urban centers. Karachi and Lahore, the two largest cities of Pakistan, have privatized garbage collection[9] with varying degrees of control at the local level[10]. Punjab plans to establish solid waste management companies across seven cities  as part of its sanitation roadmap and commence a district-level survey to earmark sites for waste disposal.

Provinces are also improving access to clean water. The Saaf Paani company is restoring non-functional water schemes in 37 rural tehsils of South Punjab and is keen to scale-up the program across all districts (rural and urban). Water quality testing is also routinely conducted in most cities by the Pakistan Council of Research on Water Resources (PCRWR). Its most recent report  estimates that 10 to 15 percent of bottled water is contaminated with excessive levels of either arsenic or sodium.[11] Most filtration plants  in cities are only capable of cleaning arsenic.

Untreated industrial and municipal waste water remains a major health hazard in cities.[12] In smaller cities, sewage treatment facilities are virtually non-existent. The situation is not much different in larger urban centers.[13]

Health

As use of basic public health services remains low in both rural and urban areas, key health indicators among Pakistan’s urban poor are only marginally better than the rural poor.

After a hiatus of several years following the 18th amendment, Pakistan finally has a National Health Vision (NHV) 2016-2025 to help prioritize health interventions post-devolution. All four provinces have a Health Sector Strategy. Healthcare commissions are functional in each province, regulating public and private health facilities while ensuring their compliance to minimum standards.

Technology and improved data collection at both the federal and provincial levels are significantly changing health service delivery. Islamabad has a Health Policy Strengthening and Information Analysis Unit[14] to collect health data  while health information systems are functional across all provinces. The use of internet communications technology, particularly supported by the Punjab Information Technology Board (PITB), is helping improve healthcare in the province especially for controlling dengue[15] and enhancing immunization[16]. Polio cases are declining steadily as both KP Punjab have launched successful inactivated polio vaccination (IPV) campaigns.

Health insurance is big on the cards as the Prime Minister launched the first ever national health insurance scheme in Pakistan last year while KP has introduced its own program via the Sehat Insaf Card[17].

Efforts to improve tertiary healthcare, however, remain inadequate as several large-scale projects remain incomplete.[18] Provinces are now engaging with the private sector to establish modern hospitals just as several primary health care services are also being outsourced.

Transport

Pakistan’s mega urban centers like Karachi are without a mass public transport system and investments in roads in place of public transport have  led to an unregulated rise in private vehicles with fewer options of public transport for the poor.[19]

The federal government has only recently signed a two-year project to formulate the first National Transport Policy with support from the United Kingdom’s Department for International Development (DFID) and the Asian Development Bank (ADB) for a safe, efficient and sustainable transport system. Provincial governments are making significant investments in low-cost public transport. These include mass transit projects in Islamabad, Lahore, Multan, Karachi and Peshawar.[20] Specialized transport bodies such as the Lahore Transport Company, Karachi Urban Transport Corporation and Punjab Metrobus Authority are helping manage city travel. But given the transportation needs of megacities, further investment in feeder or connecting routes is required. Currently, the construction of feeder-route networks to connect to Islamabad and Lahore are in the pipeline but facing administrative delays.

Inadequate public transport has fueled a rise in private taxi services (Albayrak, Uber and Careem). New provincial regulations in Sindh and Punjab will require these services to acquire route permits, fitness certificates and be subject to taxes. Vehicle inspection regime remains weak. Punjab has taken the lead by setting up vehicle inspection and certification system centers across the province.

Pakistan’s transport sector needs to prepare for the rise in economic activity expected in urban centers following investments under CPEC. Introducing the right land-use policies and investing in low-cost public transport can help meet the likely increase in demand.
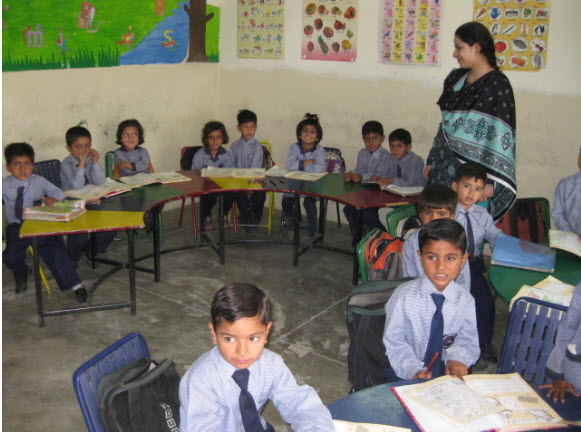
Education

Although urban areas have better enrolment and learning outcomes, a significant number of children remain out of school.[21] The preference for private schools remains high, reflecting in part the low quality of public schooling.

The National Education Policy was announced in 2009 and provides broad goals. Provinces, responsible for education after the 18th amendment, have failed to reach a consensus on a revised policy. There are four education plans, one for each province.[22] Punjab’s expires this year and Sindh’s next year. The status of Article 25-A of the constitution that ensures the right to free and compulsory education post-18th amendment is still pending in KP, Gilgit-Baltistan and Azad-Jammu and Kashmir (AJK).

Provincial education departments are embedding education reforms within broader provincial plans. Punjab has adopted the roadmap approach for improving public schools. [23] The Schools Reforms Roadmap is based on “stock-takes” that track progress on education outcomes. Sindh and KP are implementing a similar model. The approach however varies across provinces in terms of leadership and management style. For example, progress in Punjab, unlike KP, is managed personally by the Chief Minister. This raises the question of whether centralized control is the right way to achieve outcomes as opposed to granting more responsibility at the local level.

All four provinces are now relying on technology-driven, “smart” monitoring techniques to manage the performance of public schools.[24] Provinces are also moving towards the merit-based hiring of teachers, now being recruited through rigorous testing conducted by a third-party service.

While the overall impact of these reforms is yet to be seen in terms of increased enrollment and learning outcomes, education roadmaps are helping to create a culture of evidence-based policymaking.

Land Management

Unregulated land use remains one of the top causes of ill-planned urbanization.

A policy mandate to manage urbanization has been slow to emerge at the federal and provincial levels. The need for smarter urban development first appeared at the heart of Planning Commission’s New Framework for Economic Growth in 2012. The incumbent government’s “Vision 2025” and 11th Five Year Plan (2013-18) roll out a similar agenda. Vision 2025 particularly emphasizes legal reforms for zoning, commercialization, taxation and improving urban infrastructure.

The Planning Commission recently established the Urban Planning & Policy Center to pursue smart, sustainable urban development in Pakistan. Provinces are also gearing up. The Punjab Growth Strategy endorses support for dense urban centers to attract investment and boost productivity while urban policy units in KP and Punjab are conducting research to inform urban policies. Provinces are also digitizing land records to facilitate administrative and economic decision-making and improve land allocation in urban centers.[25]

However, provinces have not designed industrial policy that looks at land usage and development of new cities[26], especially as industrial investments under CPEC are already being made[27]. While Punjab is currently identifying areas with the best potential to develop into cities and industrial estates, other provinces need to follow suit to align economically with CPEC.

What Next?

While there are many real and headline-grabbing urban initiatives (some are successful, many are not), they are not being pursued in a systematic framework for urban development. This has led to the poor prioritization of initiatives. Sensible urban development strategies are thus now essential for all provinces.

Pakistan will launch “The State of Pakistan Cities Report 2016”[28] this year to provide updated data on key urban indicators. The rollout of the population census, after a gap of 19 years, will also be very helpful. A fresh census will depict the true extent of urbanization and the size of the urban vote bank[29].

Given the size of the urban vote bank, there are political incentives to bring about sustained change. Responding to these incentives will require being guided by evidence to pursue the right development path – and learning from best local and international experience. This makes for excellent opportunities for collaboration between researchers and policy makers and will be taken up in the final blog in this series.

Ijaz Nabi is the Pakistan country director at the International Growth Centre.

Hina Shaikh is a Pakistan country economist at the International Growth Centre.

[1] Urban land in Lahore remains under the control of the Lahore Development Authority while only a third of Karachi’s land is under the city government.

[2] Aims to provide 50,000 low-cost housing units in the next 2 years. If completed the scheme will meet no more than 0.6 percent of Pakistan’s housing shortage. The government launched a similar housing scheme back in 2010 as well. Original target was to build 50,000 housing units in 21 cities of the province but in the past 5 years the government built just 370 units in only 3 cities.

[3] The Rs 500 million Apna Ghar Scheme announced in Punjab in 2013 remains limited to files. Under this scheme, the federal government was to construct 500,000 housing units in five years, under a PPP-mode, on land to be provided free of charge by the province.

[4] Pakistan Housing Authority (under the Ministry of Housing and Works) has over the past 15 years constructed only a few thousand housing units with none for low income groups. While the federal ministry is responsible for acquisition and development of sites as well as construction and maintenance of federal government buildings it bears no direct responsibility for provision of shelter to the poor.

[5] Water, Sanitation and Hygiene services

[6] Punjab WASH sector Development Plan 2014-2024, Baluchistan has also developed a 10-year WASH sector plan undergoing approval

[7] Punjab has launched a separate road map for water and solid waste management

[8] Sindh has a drinking water and sanitation policy 2016 awaiting approval while KP’s drinking water policy 2015 stands approved. Punjab has a drinking policy 2011.

[9] In Lahore, two Turkish companies were awarded a seven-year contract, by the Lahore Solid Waste Management Company valuing USD320 mn for solid waste collection, disposal and washing, back in 2012. After five years, the Sindh Solid Waste Management Board followed suit by awarding a Chinese company a USD25 mn contract for garbage collection in 2 districts of Karachi.

[10] By appointing political leaders from Lahore on the board of the waste management company, mayor of Lahore is directly engaged in supervising efforts to keep the city clean. Sindh however is centralizing the function of waste collection at the provincial level.

[11] The water quality control cell of the civic agency in Islamabad also found 53% of the water samples collected from various parts of the city unfit for human consumption.

[12] In Karachi, only two of its three waste water treatment plants are working, processing around 11% of the city’s sewage with more than 400 million gallons of waste water being dumped untreated into the rivers and, ultimately, into the ocean every day. A survey conducted by the AJK environmental protection agency has said that more than 70% spring water is being contaminated by sewerage lines running close to springs.

[13] After about seven years in operation, the only sewage treatment plant in the federal capital was closed down due to the faulty equipment and insufficient inflow of sewage. AJK government also claims to spend millions of rupees on water supply schemes but there has no visible change. Karachi has only recently launched a Sewage Treatment project, to be completed by 2018, for treating 460 mn gallons of sewage per day

[14] Established in 2015, it is equipped with a dashboard to collect credible data related to healthcare with support from USAID.

[15] A specialised Dengue Tracking System, based on an Android phone application given to field workers helps them keep records of dengue-related spraying activities by uploading geo-tagged photos of the spraying through the application.

[16] A digital system, E-Vaccs, launched in 2014 is monitoring the attendance of all vaccinators sent out into the field making immunization campaigns especially effective leading to rapid rise in coverage and increasing attendance of vaccinators from 36 to 94%.

[17] Plans to provide 1.8 million families across the province free treatment facility in public and private sector hospitals.

[18] A maternity healthcare project the Mother and Child Hospital, much needed for Rawalpindi, was started in 2005 at a cost of Rs2.5bn by the federal government remains unfinished to date. Other projects that remain incomplete include the construction of Surgical Tower at Mayo Hospital and extension of Services Hospital OPD in Lahore.

[19] Overall, inefficiencies in the performance of the transport sector costs Pakistan’s economy 4 to 6 percent of GDP – ADB estimates – Werner E. Liepach, ADB Country Director

[20]Metro Bus projects (orange and green lines) in Lahore, Multan, Islamabad-Rawalpindi and now Peshawar. Under transport infrastructure, these projects are now included within the CPEC framework such as rail based mass transit projects for all provincial capitals under which comes the Peshawar greater circular railway, Quetta circular railway, Karachi Circular Railway (KCR) and Lahore Orange Line train projects

[21] Close to 10 percent of all children in Lahore, Karachi and Peshawar remain out of school. Currently Pakistan has the highest number of out of school children in the world estimated at 12.3 million at primary level.

[22] These plans can be accessed from the provincial education department websites

[23] Sir Michael Barber’s ‘deliverology approach is based on first understanding the service delivery chain from top to bottom and then establishing a small team in a central delivery unit, gathering performance data to set targets and then tracking them periodically

[24] KP has launched the first ever automated management system for schools. Punjab has launched a smart monitoring of school initiative, employing over 900 monitoring and evaluation assistants to make field visits and collect data on android tablets. Sindh’s clustering policy 2016 aims to centralize control of government schools by grouping schools within close proximity to ease coordination and monitoring and developed a directorate of monitoring and evaluation. Balochistan is using its BEMIS cell to engage in software-based monitoring activities.

[25] The Sindh Revenue Board has computerized close to 95 percent of the province’s rural and urban land, while Punjab plans to do the same for urban land following complete digitization of all rural land records. KP, AJK and Balochistan are also computerizing their land records though progress has been slower.

[26] Punjab is looking at the potential to develop a new city to act as an industrial zone[26] along the Lahore-Islamabad motorway

[27] The Planning Commission confirms nine industrial parks, to act as primary hubs of industrial activity in the country, are included in the CPEC framework to be built across four provinces

[28] Report is being spearheaded by the Ministry of Climate Change (MOCC) with technical assistance from the United Nations Human Settlements Program (UN-Habitat) and funded by the Australian Government. This will provide updated information on key urban indicators for first level cities across Pakistan, establish appropriate urban baselines, analyze development trends and challenges to estimate the potential for investment and growth.

[29] Current estimates suggest that about 40% of the total electorate is now urban

What we still don’t know about the Lawyers’ Movement

LawyersMovement_Wiqi22_CCBY-SA3
(Image credit: Wiqi22, CC BY-SA 3.0, Wikimedia Commons)

By Maryam Khan

The Lawyers’ Movement is too fresh in our collective memory to need any introduction. It has attracted ubiquitous media coverage and commentary, invited praise and accolades as well as severe criticism from various quarters, and piqued the curiosity of legal bars and legal thinkers around the world about the potentialities of political lawyering.

It is now almost a trope to state that while the Movement accomplished its most immediate mission of reinstating arbitrarily deposed judges, it fell short of many other expectations. But missions and expectations aside, we are yet to fully comprehend how the Movement happened, who were its protagonists and catalysts, and who were and are its beneficiaries.

These questions are not merely an exercise in intellectual or nostalgic indulgence. They push us to think of fresh optics to analyse the Movement. Looking back at how the Movement was organized and the motivations behind it can tell us a lot about the structural synergies and dependencies between the bar and the bench, and how this nexus between the two generally impacts access to justice in Pakistan.

To begin with, we know very little about how spontaneous the Movement was. The peremptory removal of judges by military dictators is not an uncommon occurrence in Pakistan’s judicial history. The historical record raises questions about why and how the legal bar mobilized, especially in support of Chief Justice Iftikhar Chaudhry.

To be sure, the media played a role in sparking the ire of the legal community, just as the widespread anti-Musharraf sentiment helped in creating cross-party associational coalitions against his regime. However, while one could think of these factors as immediate or enabling triggers for the Movement, they are not sufficient in explaining such an unprecedented legal mobilization.

Three important lines of inquiry may provide the missing pieces of the puzzle. One is the internal organization of the legal bar and its various components. The second is the larger structural relationship between the bar and the bench. The third is the network of linkages between the bar and political parties. The alignments and power dynamics of the legal bar that emerge from the complex interplay of these three factors can give us a fuller picture of the organizational capacity of the bar to mobilize in general, as well as about the specific interests, alliances and motivations that drove the Movement.

Another lingering question is about how widespread or far-reaching the Movement was. How far down did it extend into the internal hierarchy of the bar? What was the relationship between the bar leadership and the rank and file, and how were decisions at the top disseminated and executed across bar organizations? What was the Movement’s spatial spread across different regions? Was it a pervasive Movement or was it limited predominantly to northern and central Punjab as some have claimed? What was the nature of the symbiosis between the bar and the political parties, and to what extent did the political parties advance the interests and objectives of the Movement?It would appear that the Movement was not as “spontaneous” as is commonly believed, and that it was built and sustained on the foundation of important institutional relationships and alliances that preceded the Movement.

A scrutiny of the Movement’s vertical and horizontal reach can help clarify the nature and extent of support for the Movement. This is important as it can provide us with insights about who benefited the most from the Movement, and the degree to which the success and sustainability of the legal mobilization was contingent on the self-serving objectives of these beneficiaries.

Aside from questions about the Movement itself, we are still grappling with its aftermath. How has the Movement affected access to justice, and has it changed our legal and judicial institutions in any positive way? Has it helped institutionalize our rights as citizens? Has it empowered us to hold the state and its institutions accountable? And if it hasn’t really changed anything at all, or if it has in fact led to some detrimental outcomes, why has this happened? Is there something inherent about the way, or the reasons for which lawyers mobilize that makes legal mobilization ill-suited to judicial reform and citizen empowerment?

One would be hard-pressed to deny that the Lawyers’ Movement has achieved some positives. On a very basic level, it has visibly demonstrated that some of the liberal notions of modern constitutionalism like judicial independence, political rights, and the enforcement of those political rights through judicial review, have a formidable constituency in the legal bar. This is good news.

An institutional constituency that has the capacity and motivation to mobilize for the support of judicial empowerment and independence can be an effective check on the kind of overt political meddling to which our judiciary has often succumbed in the past.

On the other hand, the Lawyers’ Movement seems to have had several negative consequences that are likely to persist in the long-term. In empowering the judiciary, the Movement has also enabled the judiciary to insulate itself from legitimate political accountability. Post the Movement, the Supreme Court has repeatedly asserted its internal control over judicial appointments, has insulated itself from political oversight, and has time and again resisted the much-needed reform interventions on the pretext of ‘judicial independence.’

At the same time, however, the Movement appears to have considerably strengthened the bargaining power of the bar vis-à-vis the bench. The fact that the judiciary owes many of its recent gains to the bar’s support for ‘judicial independence’ means that the bar is likely to remain in a position of institutional dominance over the judiciary, ensuring that the tentacles of judicial autonomy do not extend to the disciplining or reform of the bar itself.

This mutually beneficial equilibrium between the bar and the bench does not bode well for litigants or the justice system as a whole. The institutional interests of judges and the institutional and pecuniary incentives of lawyers seem to be the dominant forces determining the discourse on ‘rule of law’ and pushing back against any meaningful reform of the legal system. Of course, there are historical continuities in the institutional relationship between judges and lawyers. But we need to ask whether and to what extent the Movement has amplified this inter-dependence.

From anecdotal observations, it seems that the two institutions are even more resistant to change, even less motivated to empower the acutely neglected district and lower judiciary, and even less responsive to the many hardships of everyday litigants. Asking the tough questions about the Movement’s contribution to the deep inertia of the legal system can push us to design the right interventions for judicial reform.

Ten years on, then, the Lawyers’ Movement, is anything but history. It has raised many more questions than we can even begin to answer with our largely limited focus on its visible, grand, direct, and immediate effects. If we move beyond the obvious and outside the anecdotal, we may find that, criticisms aside, we cannot realistically expect the legal community to mobilize for anything other than the narrow agenda of political liberalism.

We may also find that it may make sense to strategically involve lawyers within larger coalitions than to expect them to willingly ally with other constituencies within their parochial associational domain. Ironically, the Movement seems to have increased our dependence on lawyers and judges to deliver justice, as well as to reform that very system of justice delivery.

Put another way, it has increased our reliance on the legal community to reform itself and disempowered other constituencies, including civil society and political actors, to bring about institutional and social change based on broader coalitions and interests.

Ultimately, looking back at the Movement prompts us to ask, what can we expect going forward if we entrust legal actors and institutions with our social and political interests as citizens?

Maryam Khan is a visiting research fellow at the Institute of Development and Economic Alternatives.

This article originally appeared under the title, “Ten years of a movement”, in the March 12th issue of The News on Sunday.

Making school reformers of head teachers

7604172502_4a581a97cc_o
(Credit: Hashoo Foundation USA CC BY-SA 2.0)

Amal Aslam 

Policymakers in Punjab are increasingly convinced that real change in education will emanate from head teachers within schools instead of through top-down approaches where government officials push changes that affect classrooms. This idea has been captured by the latest buzz term in the education reform discourse, “effective school leadership”, with policy makers seeing a vivid connection between school leadership and school improvement (and ultimately student learning outcomes).

Any reform effort in this direction will need to first map and study the configuration of head teachers in the current education landscape to understand their autonomy and to see what type, level and extent of decentralization of decision making to head teachers is required moving forward. Such a study involves a thorough understanding of how head teachers are recruited, what salary they draw, how their roles and responsibilities are conceived in job descriptions, how they are monitored as per Standard Operating Procedures and reporting protocols and the level and type of access that they have to policy makers and officials at the top of the bureaucratic hierarchy.

The Institute of Development and Economic Alternatives (IDEAS) has currently undertaken such a study for its School Leadership project to inform future reform efforts aimed at empowering head teachers to effect change.

Here is what we know so far about how head teachers operate:

The head teacher selection process is problematic

The criteria for appointing head teachers are not applied consistently and are missing an emphasis on personal traits and other qualities that makes for good head teachers.

In the past, head teachers in the public sector have been recruited or promoted to their posts entirely on the basis of seniority. There has recently been a shift, in some cases, with more educated teachers being designated as head teachers regardless of seniority. A substantial proportion of head teachers at all levels of schooling now possess a Master’s degree, although this trend is much more pronounced in middle and high schools (Figure 1).

Moreover, unlike primary schools, where 36 percent of head teachers have only completed their education till matric or intermediate levels, there are virtually no such head teachers in middle and high schools. Does a more educated head teacher, however, necessarily make for a better leader? Selection criteria right now do not consider other relevant qualities such as personality traits, attitudes and enthusiasm at the time of appointment.

Figure 1

Head teachers in Punjab
Level Number Qualifications (%)
Matric FA/FSc BA/BSc MA/MSc
Primary 34,091 24 12 30 34
Middle 7,841 1 1 21 71
High 5,692 0 0 13 86
Source: Punjab EMIS (2014)

Header teacher responsibilities are open-ended

There are currently no official job descriptions or Terms of Reference for head teachers. Whether this is deliberate or not is unknown. Head teacher roles and responsibilities originate in various government “notifications”. On paper, they have a variety of responsibilities split between two identifiable roles – “manager” and “instructional leader”. As managers and in the day-to-day running of schools, head teachers must see to the following: a safe physical and psychological climate, health and hygiene, the implementation of new government initiatives, community involvement and the management and appraisal of teachers amongst other duties.

There has recently been some devolution of financial management powers to head teachers as well. For example, they have been granted use of the Farogh-e-Taleem fund[1] at their own discretion, and they can use the school’s Non-Salary Budget in conjunction with School Council members. Head teachers are also expected to take charge of enrollment drives in March of every year and to effectively engage with the community to increase enrollment and prevent dropout. This is important for their use of funds, because the Non-Salary Budget is in fact tied to enrollment levels. Higher enrollment increases available funds that head teachers can use to improve school environment and infrastructure.

As instructional leaders, head teachers are expected to create a positive school environment where teachers and students are motivated to excel and share a long-term vision for the school with them. They are to mentor and train staff in skills and attitudes that will help realize organizational goals and groom future leaders. How much time head teachers spend, however, on managing as opposed to coaching or leading in practice remains to be seen.

Head teacher salaries are not commensurate with duties

Current salaries and allowances may not be enough to incentivize and drive good leadership in head teachers. The only difference at present between the salaries of head teachers and other teachers is that of a negligible monthly allowance of 500, 700 and 1000 rupees for primary, middle and high school head teachers respectively despite their significant responsibilities (Figure 2).

Figure 2

RoleResponsibilitiesHeadTeachers(Source: Head teacher guides (developed by the Directorate of Staff Development, Punjab)

Head teacher evaluation could be part of the problem

Right now, head teachers are monitored, ranked, and rewarded or penalized by provincial, district and sub-district education authorities based on their schools’ performance on a number of indicators. These include student enrollment and retention, student attendance, student results, teacher attendance, implementation of the school timetable and their own attendance. Head teachers collect and report data on these indicators to numerous forums and officials at frequent intervals.

Accountability measures are important but there are many potential problems that could undermine their usefulness. For example, is such reporting more intensive and invasive than necessary? Is it conducive to head teachers innovating and leading from the front or does it reduce them to mere recorders and suppliers of data to the powers that be? Is it having a motivating or demotivating effect on heads? Is reporting on these indicators comprehensive and does it capture behaviors of good head teachers effectively? Is such reporting superficial in nature and/or making head teachers complacent, causing them to perform at the bare minimum of what is required?

Apart from being answerable to higher authorities, it remains to be seen whether head teachers are able to meaningfully engage with them and to share their opinions, experiences and recommendations in policy making circles at the time of policy design and implementation. Do head teachers have grievances regarding their exclusion from these circles and are there sufficient and effective channels and mechanisms in place for them to articulate these and have them redressed?

How do we define a school leader?

In order for head teachers to be good leaders and the main agents of change in the education system, it also becomes paramount to define what exactly we mean by ‘leadership’ with illustrations and examples of good leadership by head teachers. Is there consensus on who makes a “good leader”? Is a good leader merely an effective administrator or something more? Depending on our understanding and expectations of a good leader we can set about reforming and re-imagining their space in the education landscape of Punjab.

Amal Aslam is a research manager at the Institute of Development and Economic Alternatives (IDEAS). She can be reached at amal.aslam@ideaspak.org

[1] A school fund raised by charging students 20 rupees a month